The Rise of the No-Code Economy
No-code tools have finally hit the mainstream, and there is a plethora of new companies, communities, education systems, and jobs built entirely around no-code tools and non-technical business users. Cue the rise of the “No-Code Economy.” This report shines a light on this emerging economy with industry research and success stories, as well as original research on no-code adoption, how it’s being used, and where it’s headed.
- Challenge
- Position Formstack as a thought leader in no-code and deliver a report, a promo video, panel collateral, industry spin-offs, and 400+ ads in three weeks.
- Outcome
- 1,712 leads (114% of goal) and 670 MQLs (134% of goal), with 2:46 average time on page across the report's eight pages. Delivered on time.
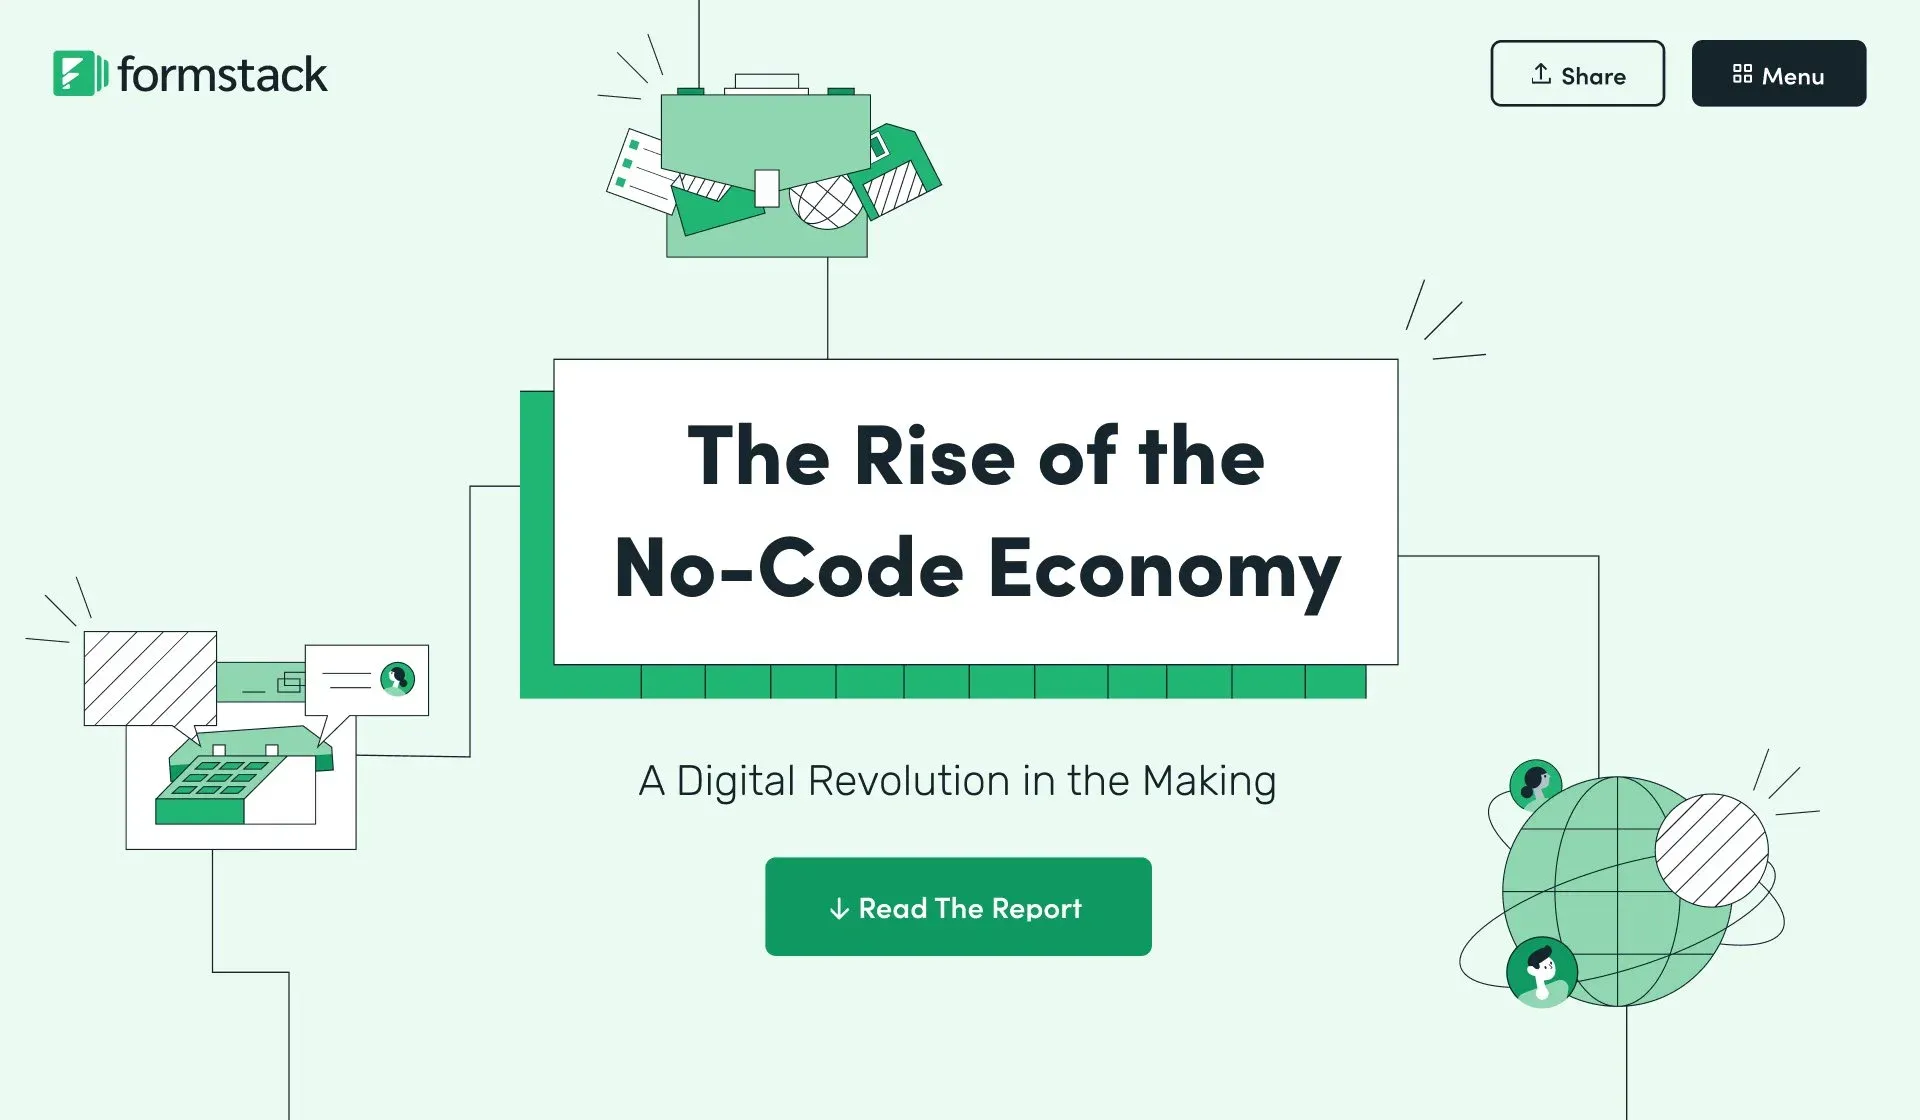
Project goals
Own the category
Position Formstack as a thought leader in the no-code space in 2021.
A complete content suite
Deliver the report, a promo video, ad collateral for our no-code panel, and role-based versions of the report for Demand Gen.
Pipeline
Generate 1,500 leads and 500 MQLs from the main report by the end of Q2 2021, from an April 13 launch.
Creative + art direction
Persona
We have two main personas in our go-to-market strategy. This report needed to speak to our Problem Solver persona: individuals with specific use cases and problems. We wanted it to feel at home in the no-code space, alongside the likes of Airtable, Webflow, Bubble, and Makerpad.
Style
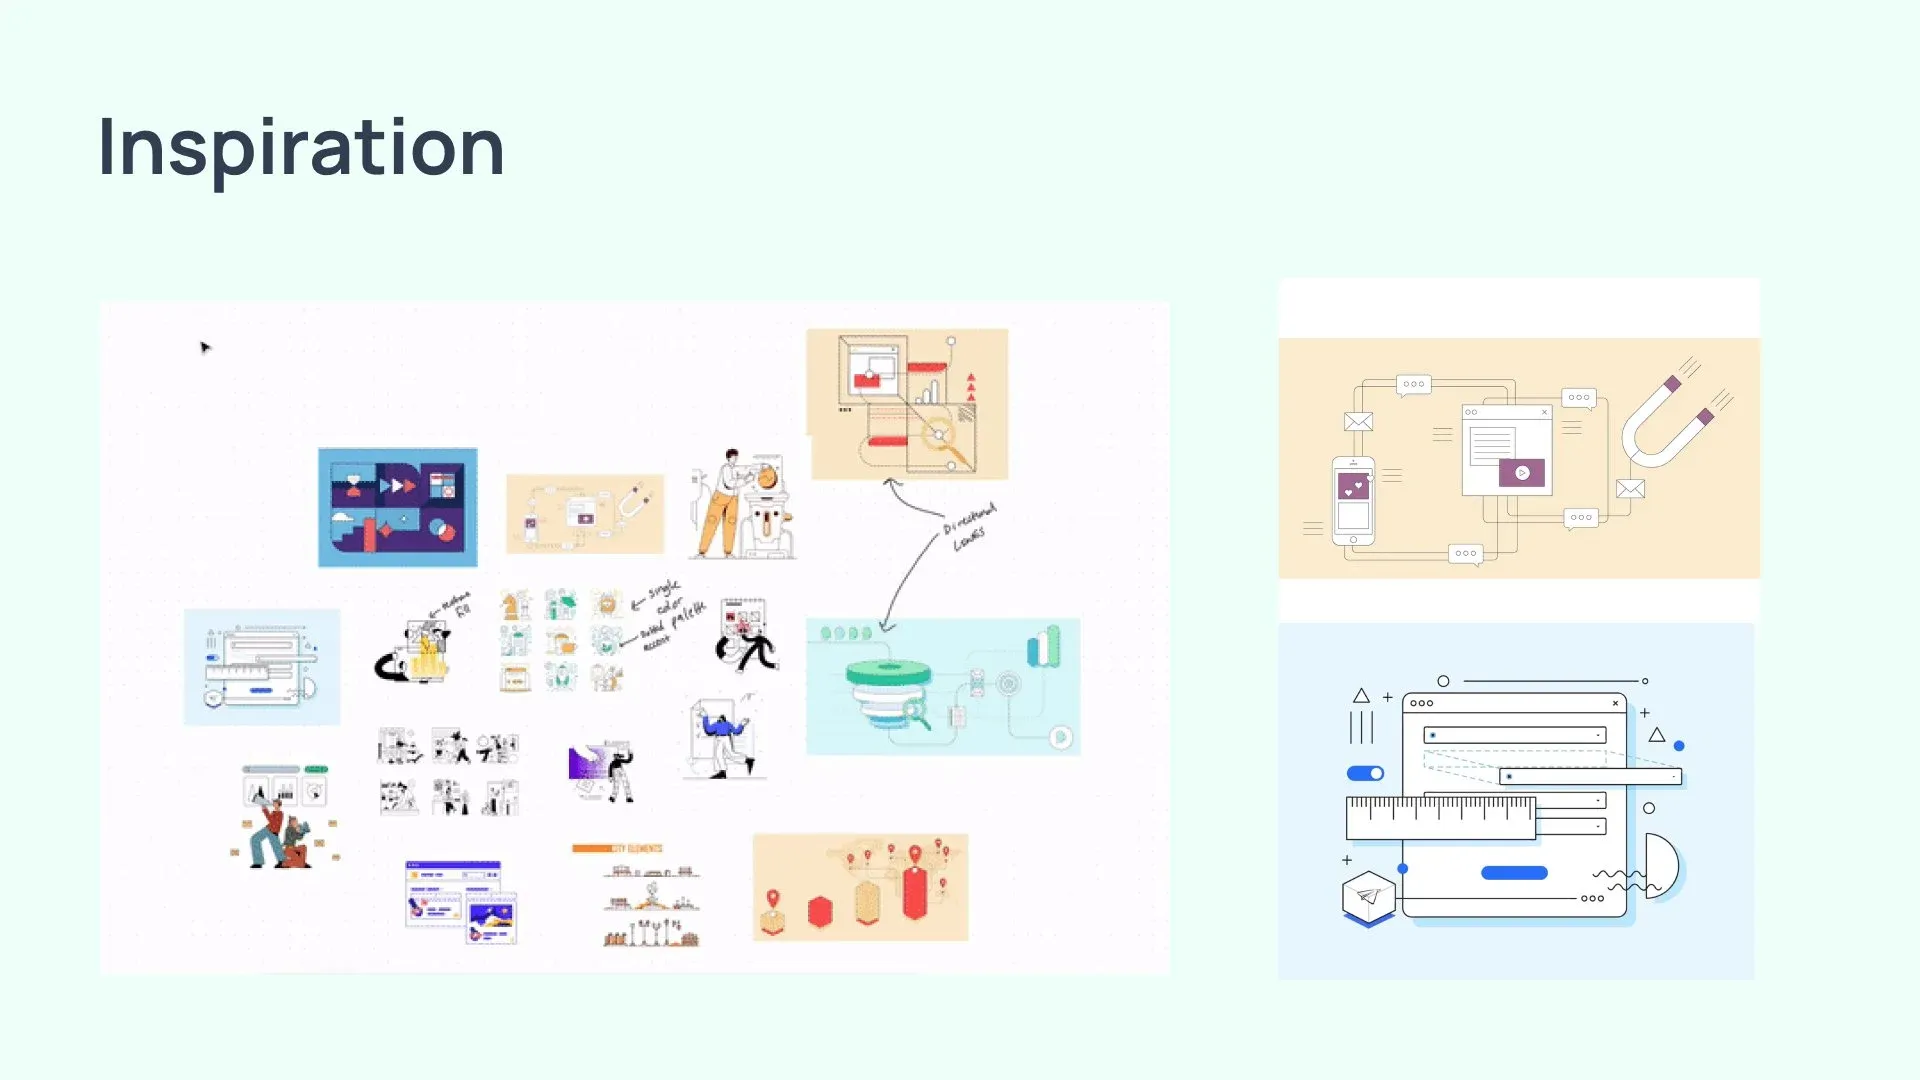
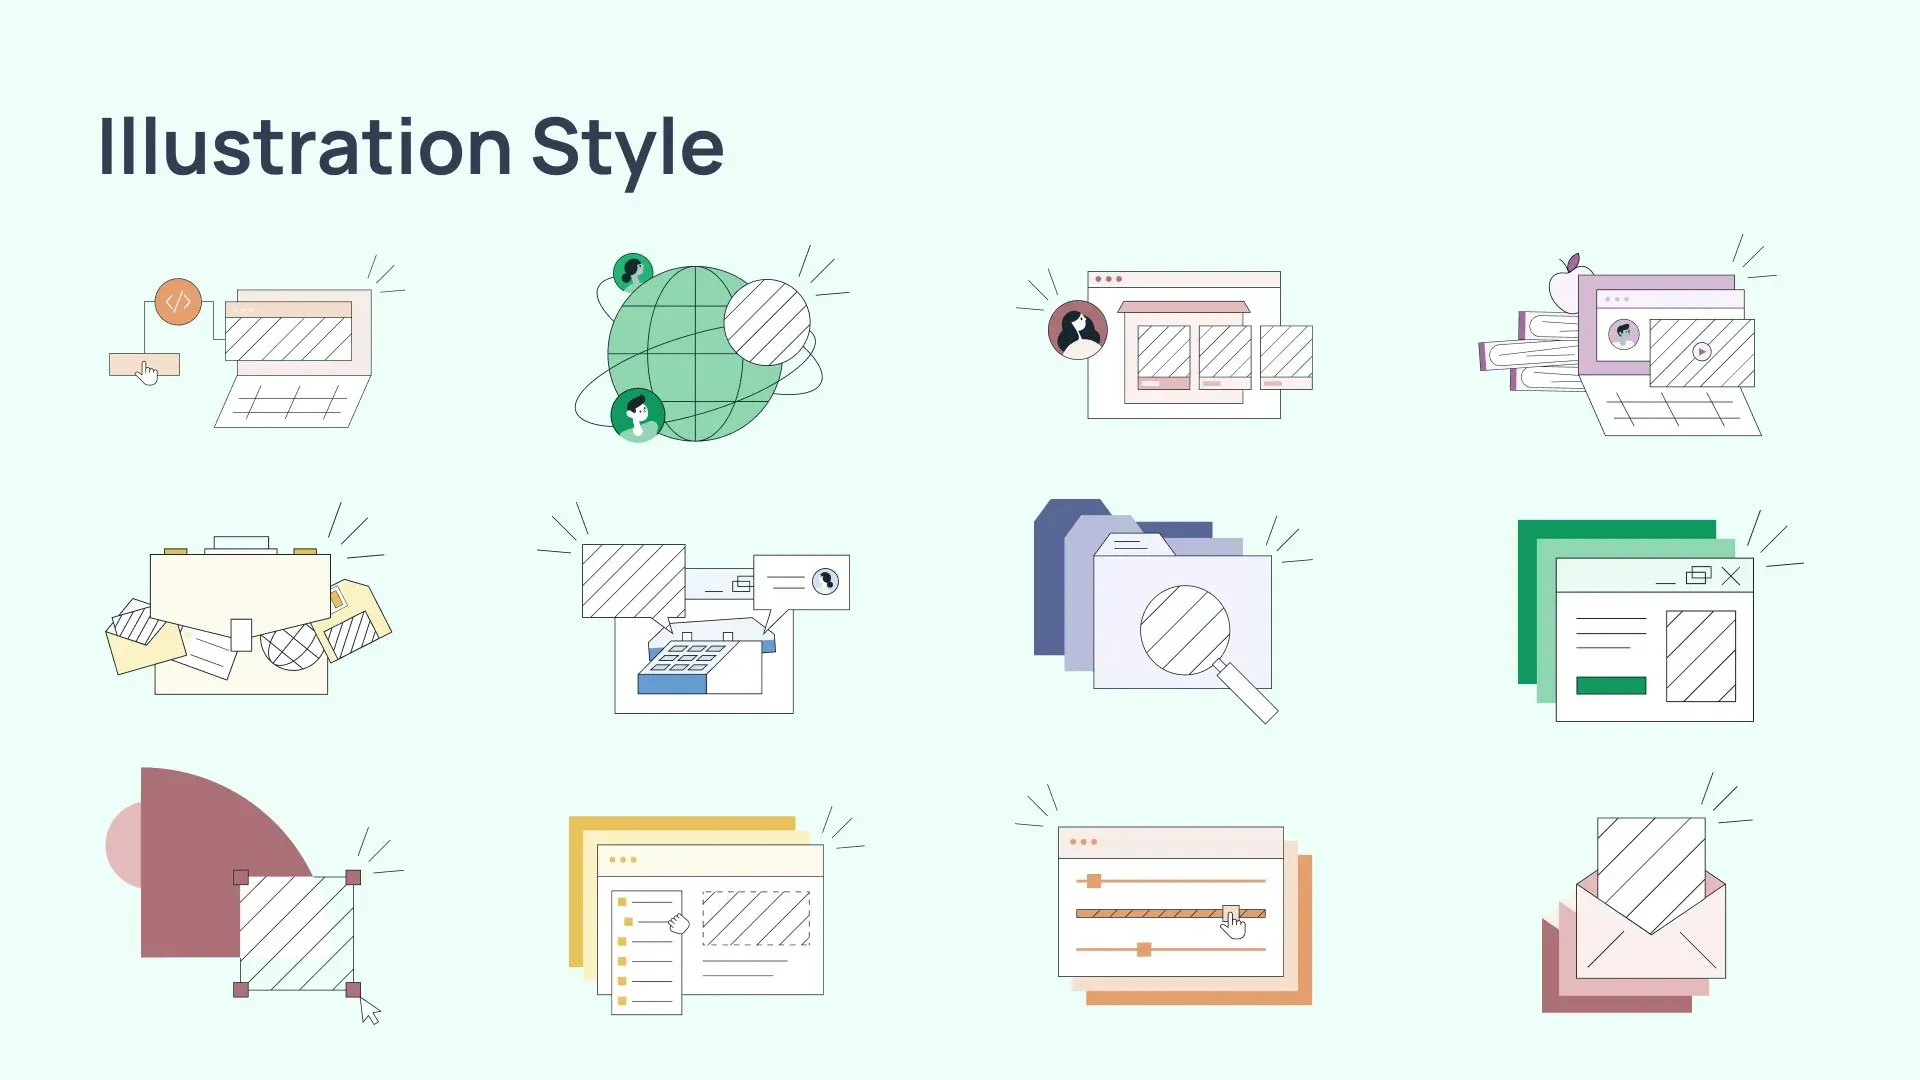
After researching the no-code space visually, we chose line-style illustrations and textures that align with our brand but have a feel all their own.
Color palette
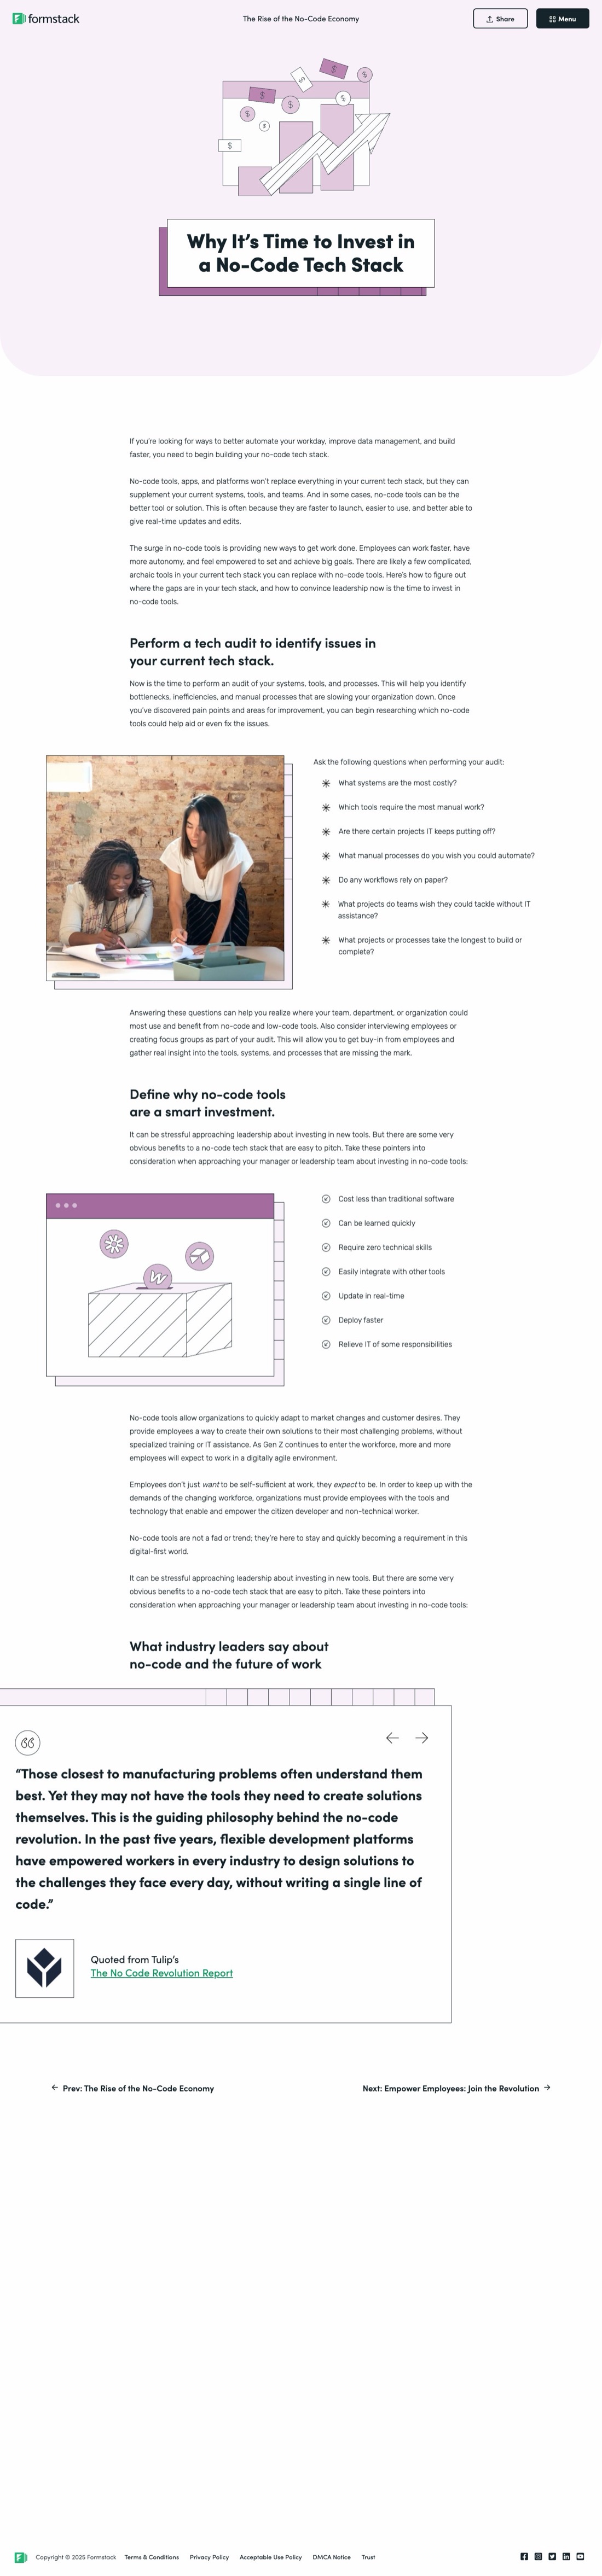
We used the full spectrum of our brand palette, not just green and slate, to bring life and energy to the report.
Delivery
Using Webflow, we built a self-contained, responsive piece of content that works like a microsite: not one long scrolling page or a huge PDF, but something more interactive, engaging, and measurable.
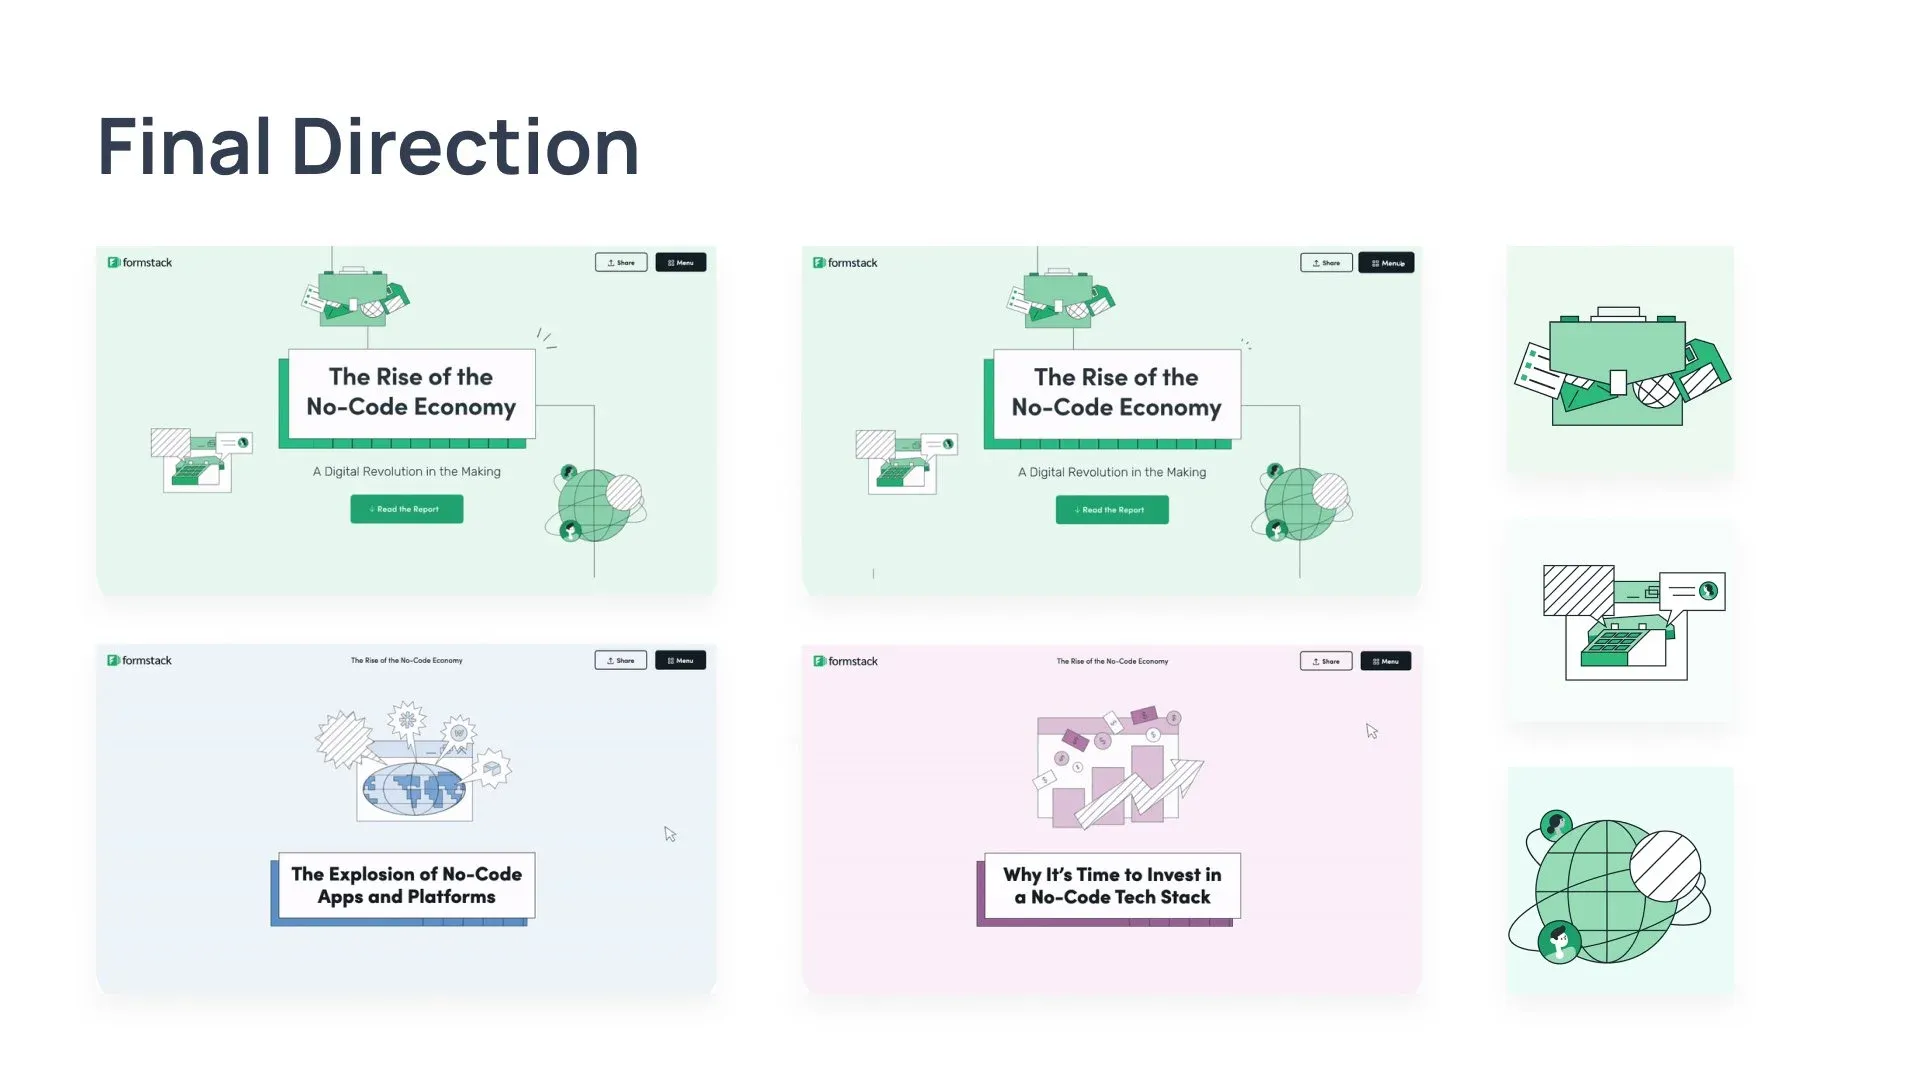
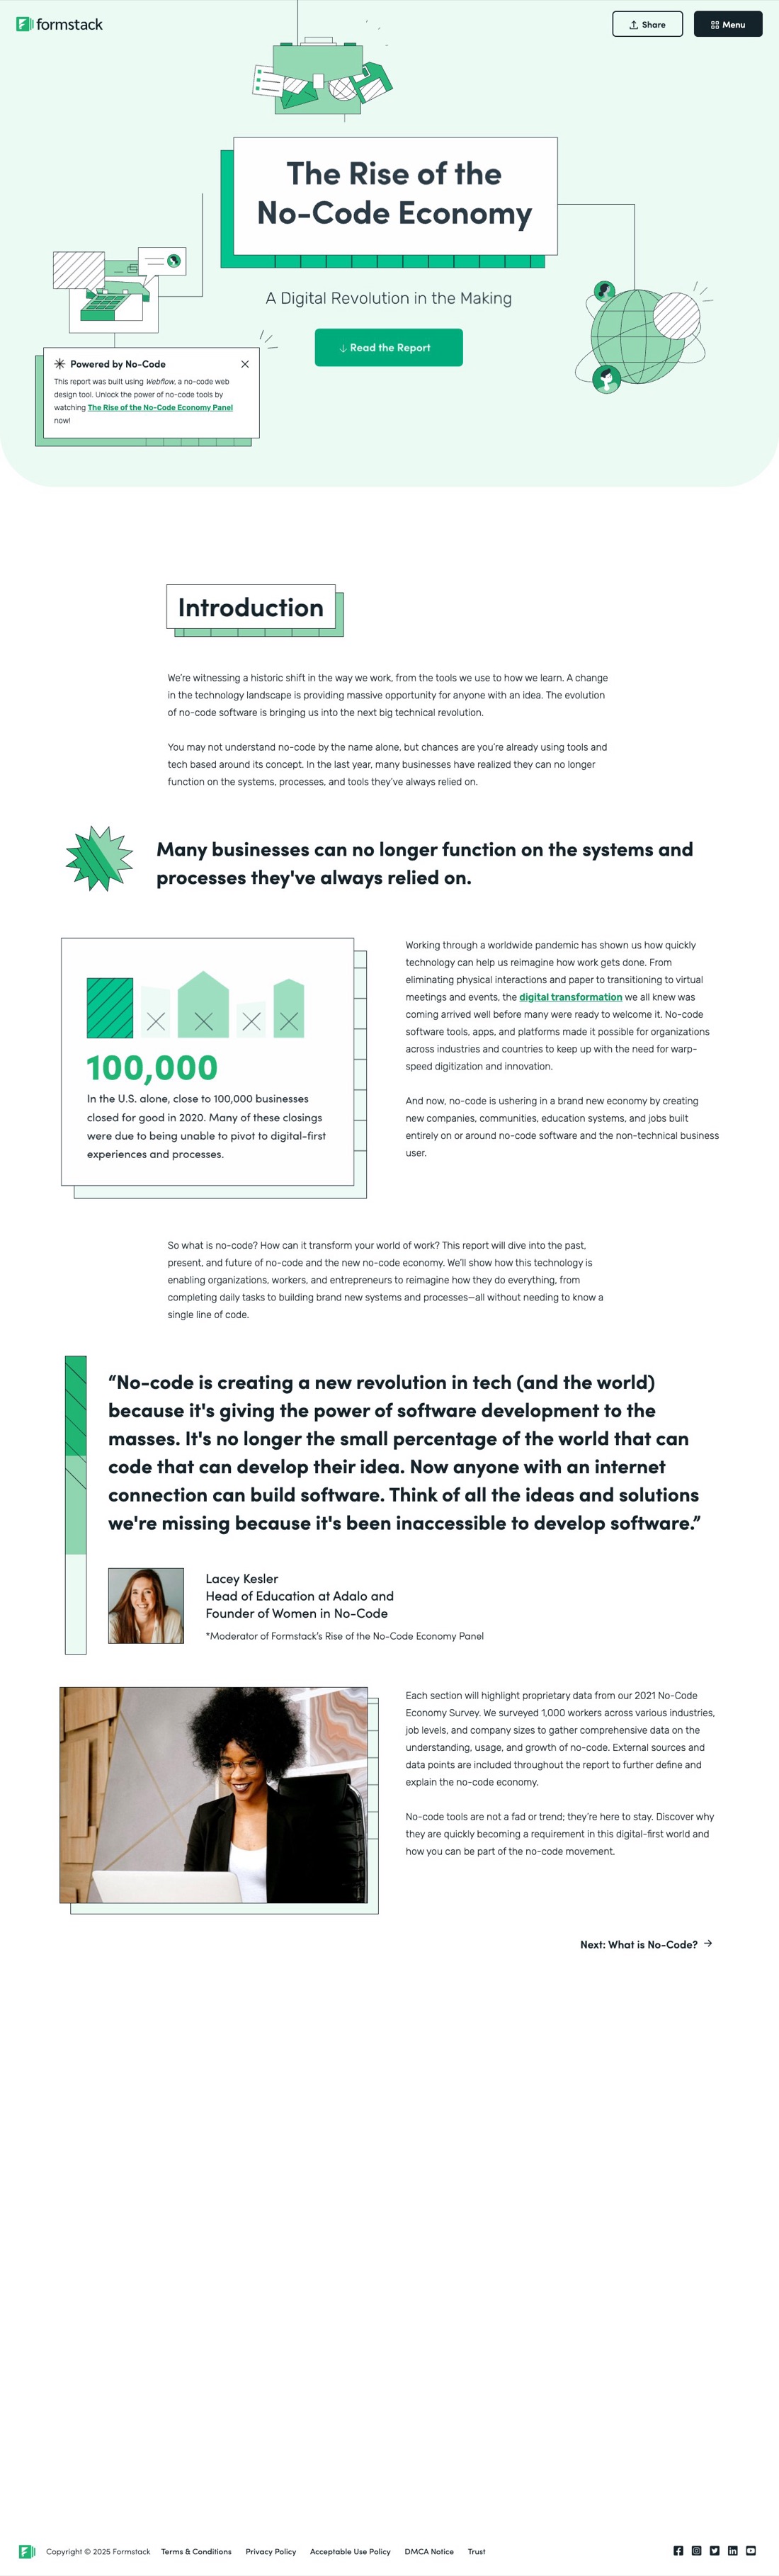

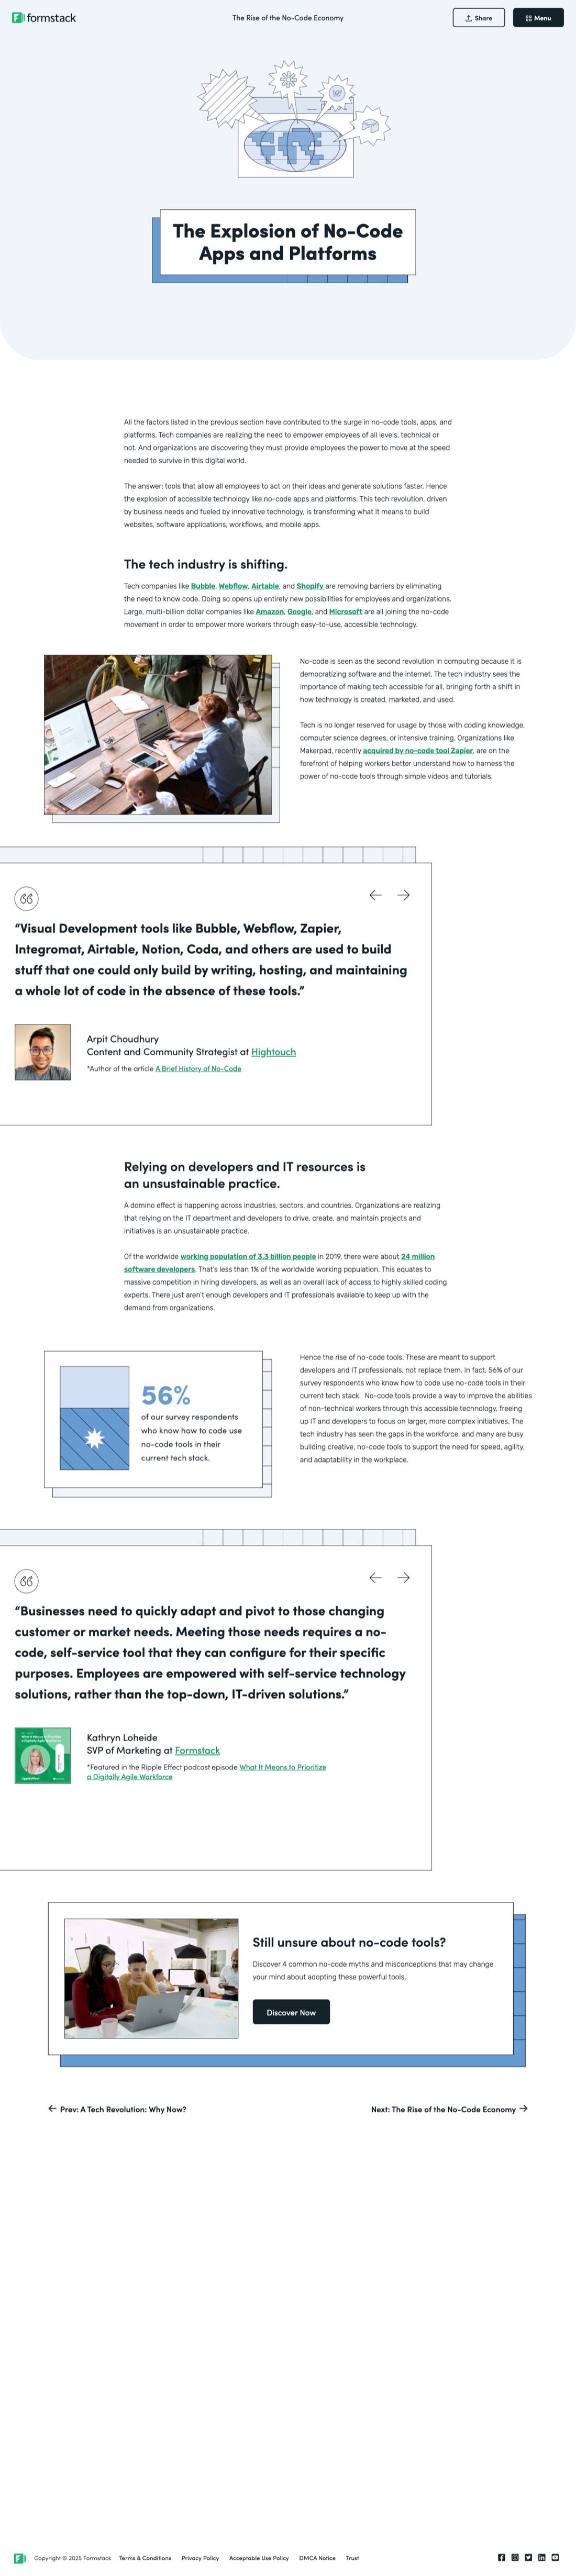
Each of the report’s chapters got its own illustrated hero and color from the brand palette, so readers always knew where they were.



Challenges
Designing for scale
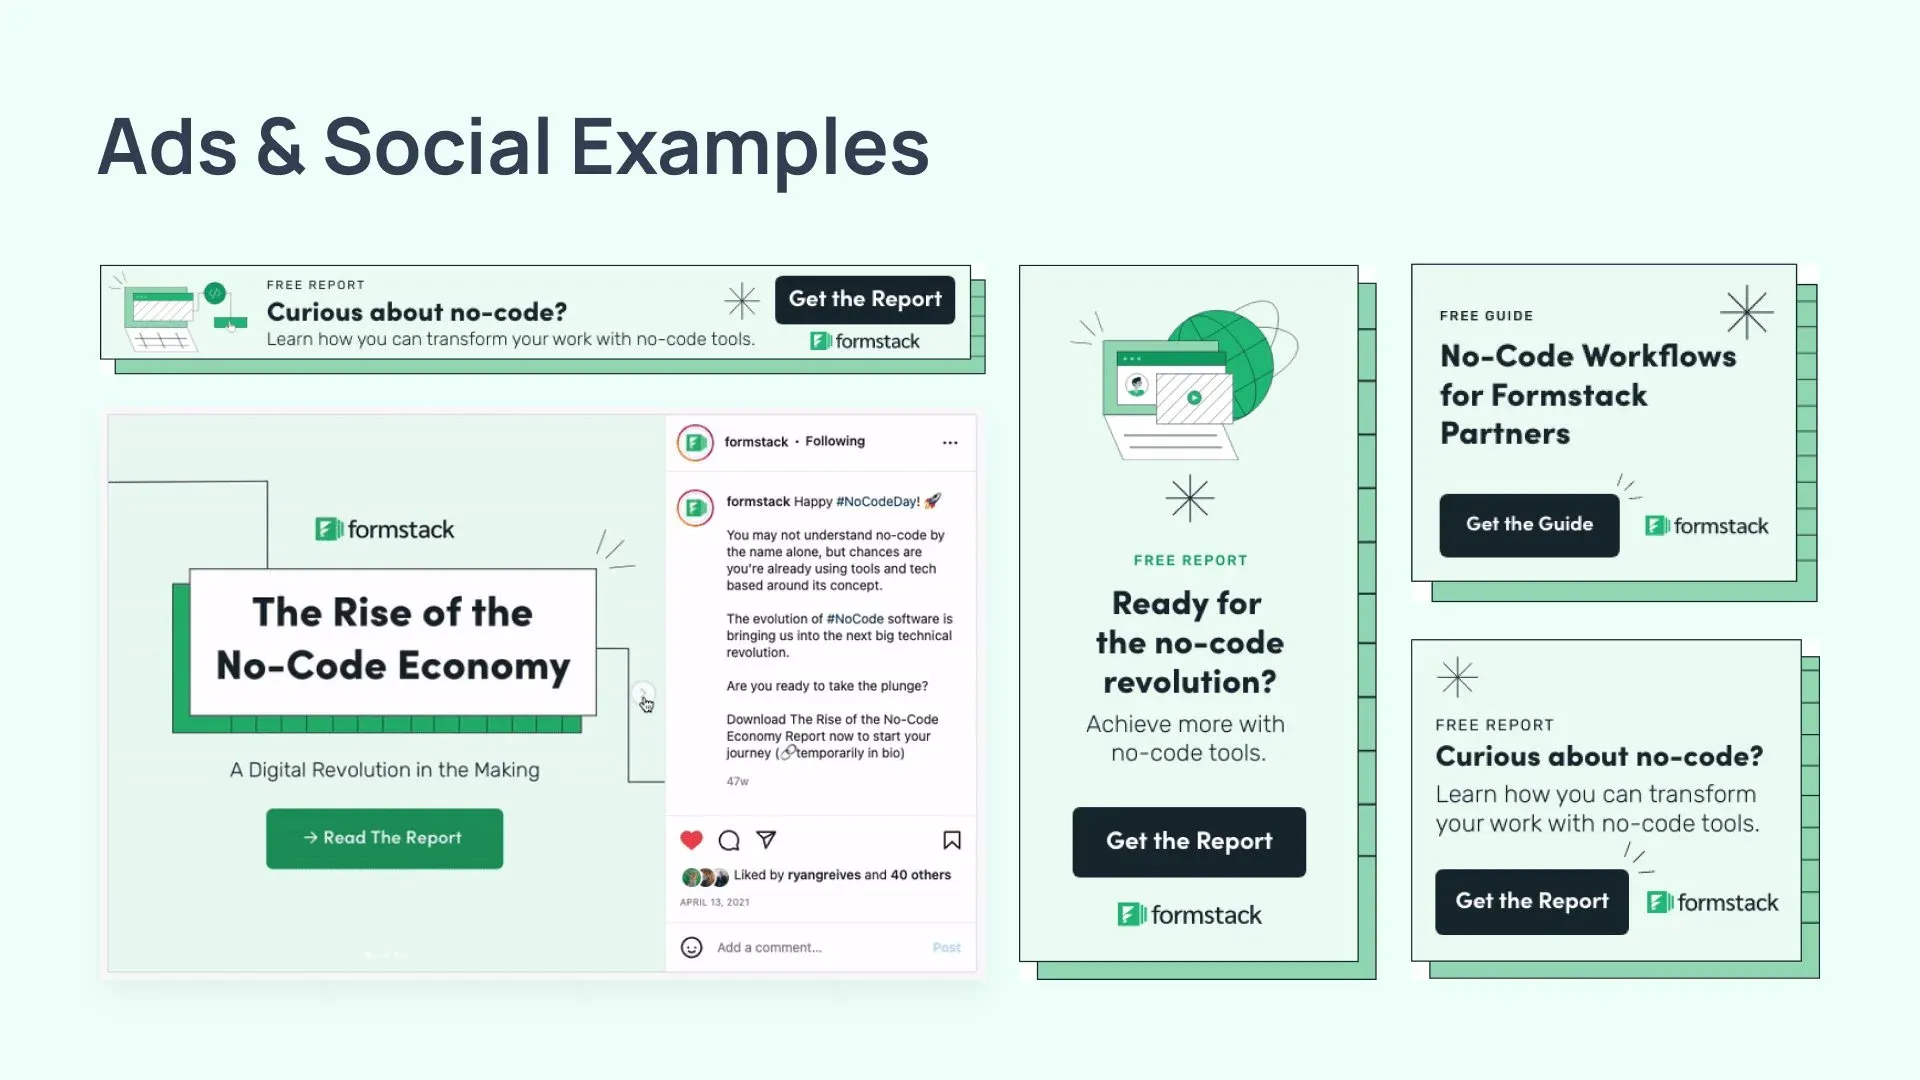
We had to produce a high volume of creative assets, including 400+ ads, in a three-week window: the main report and its promotional collateral, a 60-second promo video, ad collateral for our no-code panel with Webflow, Adalo, and Bubble, and spin-off PDF reports for Education, Healthcare, Financial Services, and Partners.
Designing for web and print
Designing for both Webflow and PDF meant creating a mini design system. We worked closely with our developers from day one to make sure what we designed was something they could build quickly.
Staying on track
We needed to stay on track as a team and measure our progress. How would we create so many assets without ever compromising on quality?
Performance + learnings
- Leads (114% of goal)
- 1,712
- MQLs (134% of goal)
- 670
- Avg. time on page
- 2:46
- Bounce rate
- 50%
Hit our lead and MQL goals
We beat our end-of-quarter goals with 1,712 leads (114%) and 670 MQLs (134%).
New ways of collaborating
The tight timeline pushed us to collaborate in ways we hadn’t before, and to create and document better processes, like exporting from Figma for After Effects.
Strong engagement
Average time on page was 2:46 across all eight report pages, in line with our best-performing blog posts (3:45 on average, but longer).
A healthy bounce rate
The main report page had a 50% bounce rate, right in line with the industry average. The navigation also showed us that readers jumped around and read the report differently than we expected.
Completed on time
Breaking the project into small milestones, and measuring our progress against them, helped us keep momentum and stay positive.